bTres screen editor
Build your own screen for the bTres
A bTres screen is one small text file. You can build one from an empty editor in about ten minutes, make it change color with the car, and put it on the unit. This page builds one from nothing, then takes apart two real screens: the DL501 adaptation helper and a full dial screen.
How it works
The editor draws a screen the same way the unit does: from a list of elements. Each element is a label, a number, a bar, a dial or a picture, with a position, a size and a monitor, which is the live value it shows. The editor feeds the preview with a recorded log, so the numbers move even with no car.
screen_N.json and any pictures.Everything in steps 1 to 3 is safe: it never touches the car or the unit. Only step 5 changes what the bTres shows.
The whole file format, in one picture
{
  "settings": { "showFooterBar": true },
  "elements": [ { "type": "text", ... },
                { "type": "textData", ... },
                { "type": "meter", ... } ]
}
The order of elements is the drawing order: later elements sit on top. There is no layer number (a z value is ignored). That one rule powers most of the tricks below.
Build one from nothing
We will make an oil temperature screen. Each step shows the editor's real preview and the element you just added.
-
Put a label on the screen
Start the editor (the Start Editor button on the screen, or press and hold a screen for two seconds). Click + Element. A new element appears at 100, 100 and its form opens. A new element is a
textelement, which is exactly what a label is. Change its words, size and color, then drag it. Dragging snaps to a 10 pixel grid; hold Ctrl to turn the snapping off.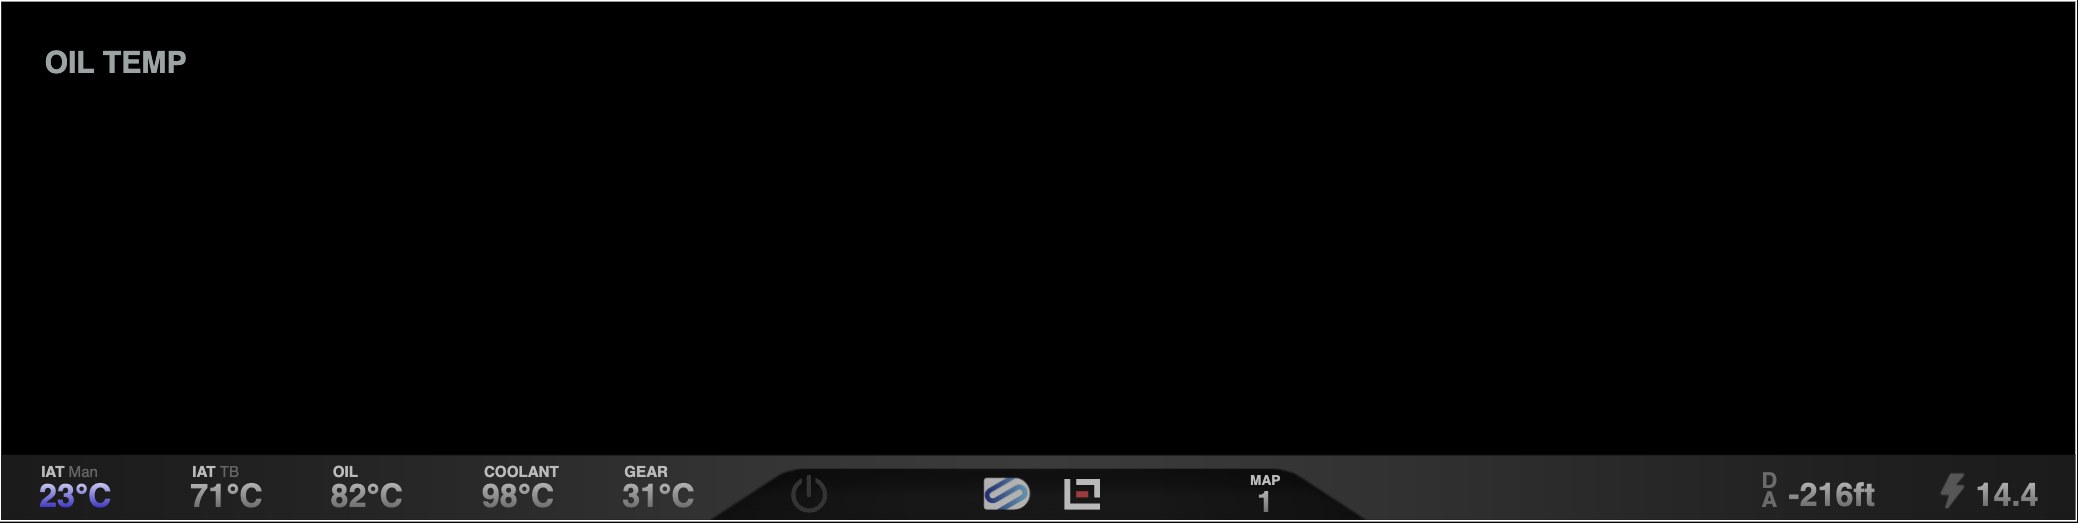
One textelement.{ "type": "text", "text": "OIL TEMP", "fontSize": 28, "fontWeight": "bold", "color": "#9ba3a3", "x": 40, "y": 40, "width": 520, "height": 39, "align": "left" } -
Show a live number
Add another element and change its type to textData. Its monitor is the live value. Pick one from the dropdown or type it in square brackets:
[toel]is oil temperature in degrees C. A long list of these names ships with the editor (354 for the RS7).decimals: 0rounds it.postTextprints a unit after the number in its own size and color.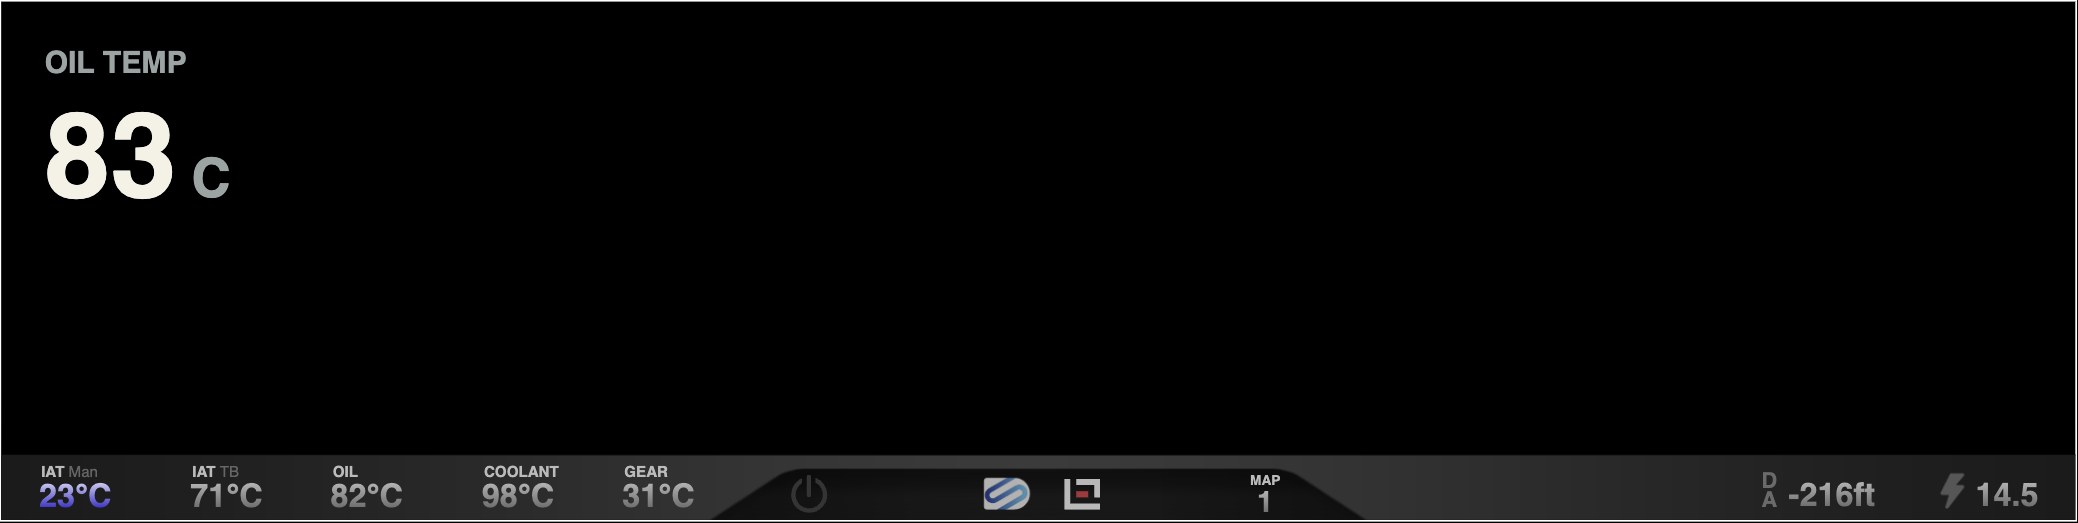
A textDataelement reading[toel].{ "type": "textData", "monitorType": "custom", "monitor": "[toel]", "decimals": 0, "fontSize": 110, "fontWeight": 700, "color": "#f4f2e6", "align": "left", "x": 40, "y": 80, "width": 520, "height": 148, "preText": "", "postText": " C", "postFontSize": 50, "postFontWeight": 700, "postFontColor": "#9ba3a3" } -
Add a bar that changes color by itself
A
meteris a bar. Give it aminandmax, and three break points. The bar draws inminColorup tolow,lowColorup tohigh,highColorup tomax, The whole bar takes one color, chosen by which zone the value is in;maxColornever shows, because values are clamped atmax. Here: amber while cold, green while warm, amber when getting hot.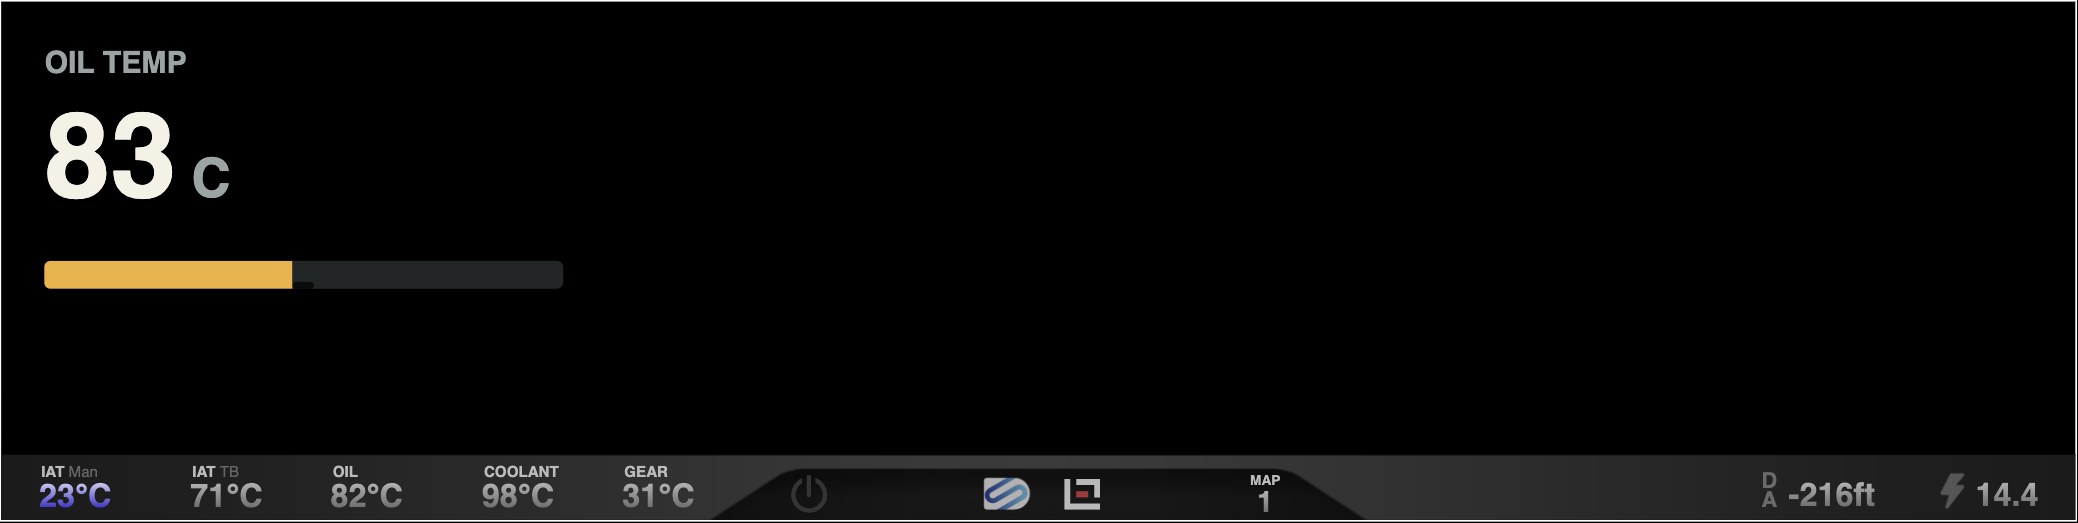
A meteron the same monitor. At 83 C the sample is still below the 85 C green zone, so it draws amber.{ "type": "meter", "monitorType": "custom", "monitor": "[toel]", "direction": "left-right", "min": 40, "max": 130, "low": 84.9, "high": 104.9, "minColor": "#f2b134", "lowColor": "#70c836", "highColor": "#f2b134", "maxColor": "#f0442c", "backgroundColor": "#222626", "showValue": false, "cornerRadius": 6, "x": 40, "y": 240, "width": 480, "height": 26 } -
Show a warning only when it matters
A monitor can be a small formula that returns words. When the test is false, return a zero-width space (
'') and nothing shows. Here the line appears from 80 C up. The sample drive sits at 83 C, so you see it in the preview.A
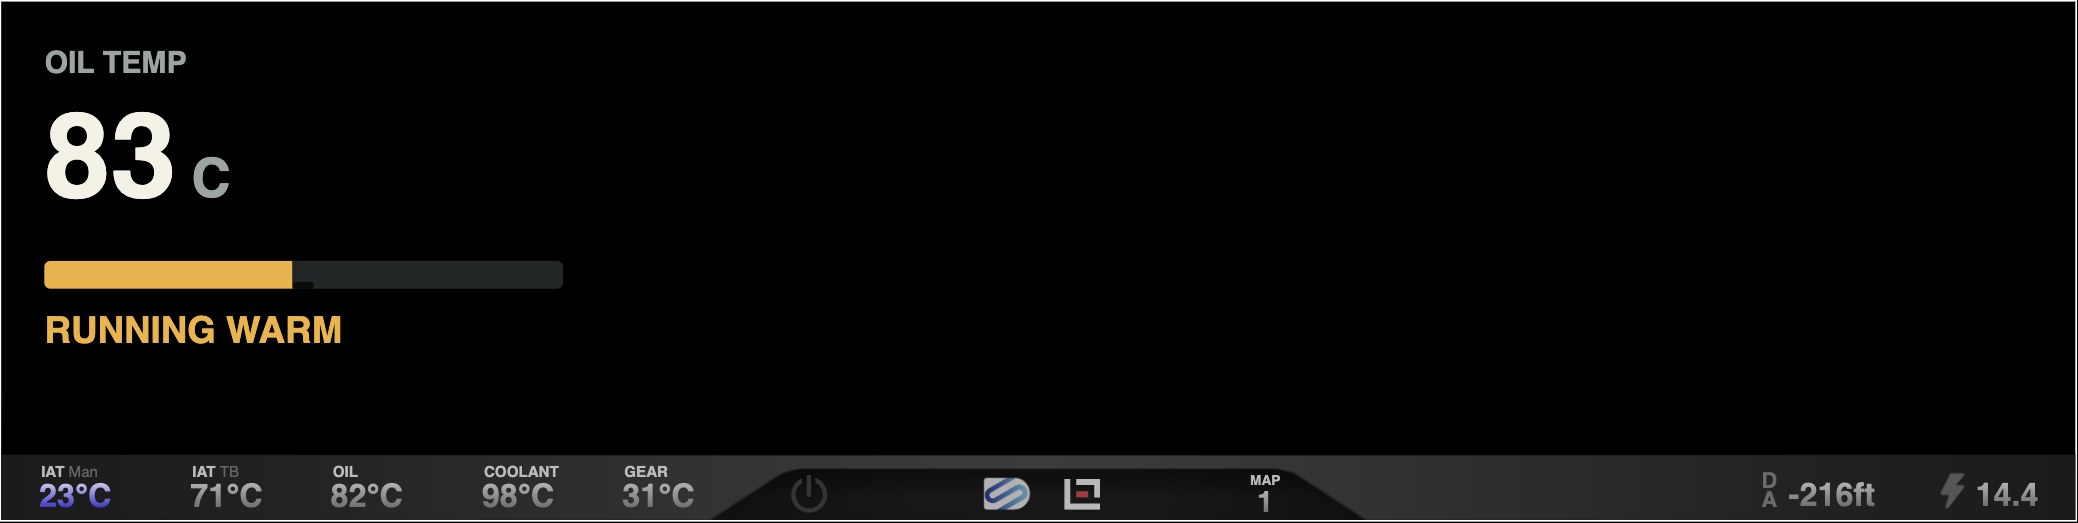
textDatawhose monitor is a test. The finished screen is the picture at the top of this page.{ "type": "textData", "monitorType": "custom", "monitor": "([toel]>=80?'RUNNING WARM':'')", "fontSize": 34, "fontWeight": 700, "color": "#f2b134", "x": 40, "y": 285, "width": 480, "height": 50, "align": "left", "preText": "", "postText": "" }Do not leave out preText and postText
When this element was first rendered without those two empty fields, the screen printed undefinedundefined. A
textDataelement prints its pre and post text around the value, and a missing field is read as the word "undefined". The editor's own form always writes them. If you write a screen by hand, or from a script, include both. -
Save, then export
Save writes the screen into the editor's list and rebuilds the menu a second later. Use Import/Export Screen, then Export Screen N. You get a ZIP holding
screen_N.json, a README, and any picture the screen uses. The unit ignores the N and adds each upload to the end of its screen list, so the order you upload in sets the order on the unit.Wait a moment between Save and Export. The export reads a copy that refreshes about a second after saving, so an instant export can ship the version before your last edit.
The seven element types
| Type | What it is | The keys you will actually change |
|---|---|---|
text | A fixed label. Its text is inserted as HTML, so a line break or color span works. | text, fontSize, fontWeight, color, align, width |
textData | A live number or a live message. | monitor, decimals, preText, postText (and their sizes and colors), minMax |
meter | A bar that takes one of its four colors by zone. | monitor, direction, min, low, high, max, the four colors, cornerRadius |
dashedMeter | A curved or segmented bar with a color gradient and no number. | direction (8 choices), minColor, maxColor, arcCurve |
radialNeedle | A round dial. Ticks, numbers, a needle, a colored arc. | min, max, majorTicks, startAngle, ticksAngle, reverse, colorPlate |
image | A picture, or a looping muted video if the file is an .mp4. | src, width, height |
app | A tappable button that opens a bTres app. Not offered in the type menu. | src, text, func |
Three keys are read by the drawing code but have no field in the editor's form: rotate (degrees), shadow (a drop shadow level) and the preText and postText font keys. You can still use them by editing the JSON, and they preview correctly.
Monitor expressions
A monitor is arithmetic over names in square brackets. The name is replaced by the current number, then the whole text is evaluated. A result that is a number is rounded to decimals. A result that is text is printed as it is.
Rules that bite
- A name the log does not have stays on screen as the raw
[name]text. That is your sign you misspelled it. - A comparison or division on its own is not evaluated.
[a]>80prints as text. Wrap it:([a]>80). - A monitor's printed result is plain text. The formula itself runs as JavaScript, though, so it can also change styles on the screen (OK to Send It does).
- Only the visible screen updates, and bars and numbers refresh every couple of tenths of a second, so a color flip can lag the sensor.
Four recipes
[toel]*9/5+32
([toel]>=85?'WARM':'')
([wped_w]>80)*[rl_w]
(([psrg_w]*0.001)-([pu_w]*0.001))*14.5037738- C to F
- Words that appear only when true
- A value that is zero unless a condition holds
- Boost in psi (the editor's default)
The trick that makes colors change
An element has one fixed color, and what a formula prints is only a word or a number. (A formula runs as JavaScript, so it can also change styles on the screen, as OK to Send It does, but that goes beyond the editor.) Without that, colors come from stacking: put three copies of the same readout on top of each other, one green, one amber, one red, and give each a formula that prints nothing unless its zone is active. The zone that is true is the one you can see.
Example one: the adaptation helper
Before a DL501 clutch adaptation, the gearbox oil has to be in a window (about 104 to 140 F), the engine idling with the selector in P (the screen only sees gear 0, which looks the same in N, so check the selector yourself), and you have to know if the idle dips at the kiss point. This screen watches all of that while you run the steps in VCDS. It uses 43 elements: 11 labels, 29 live readouts and 3 bars. It never sends anything to the car.
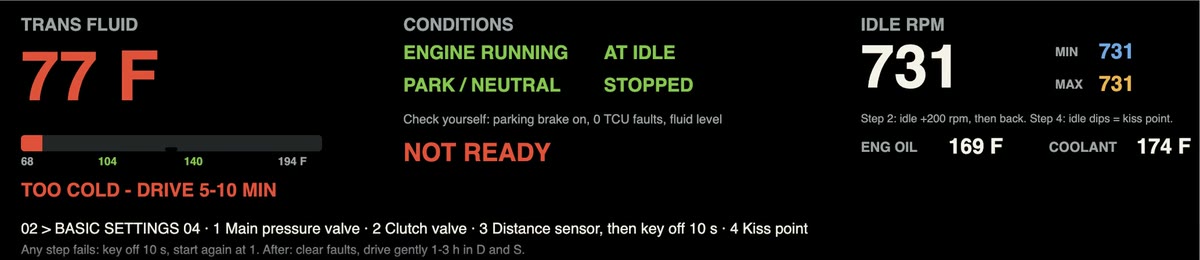
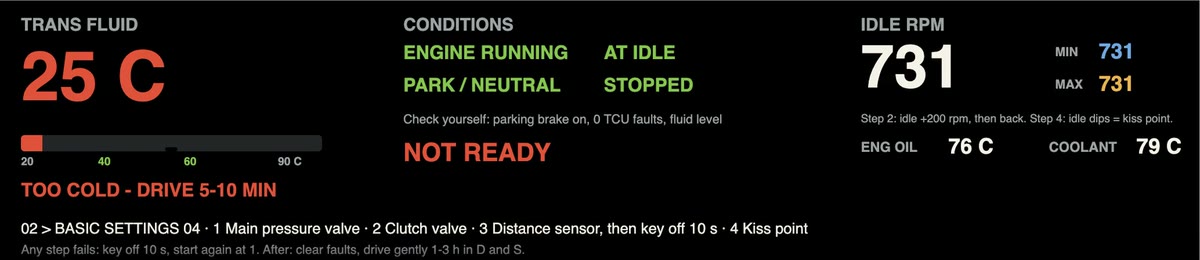
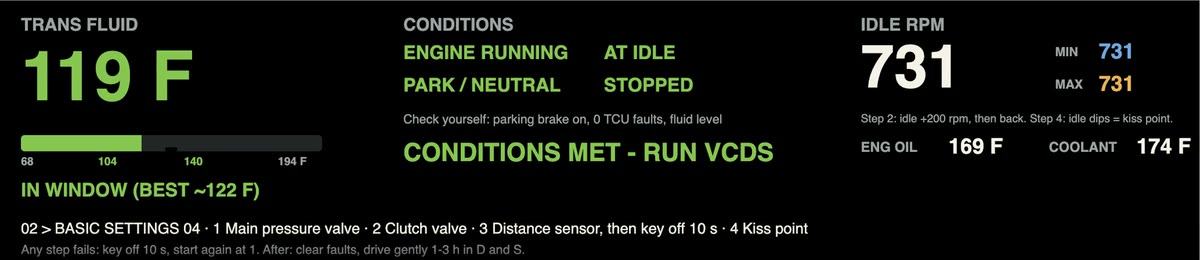
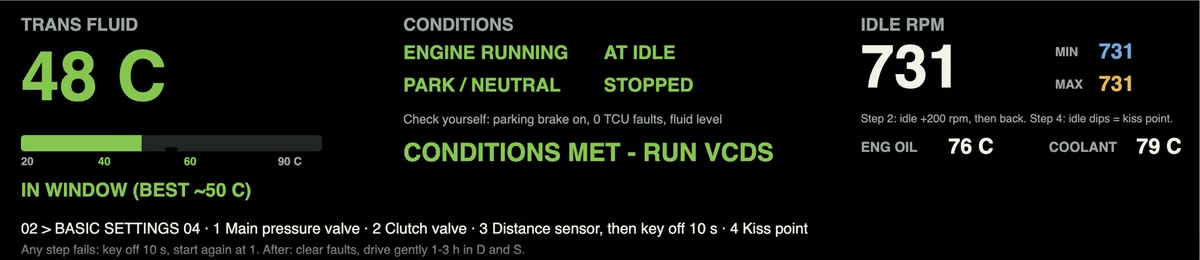
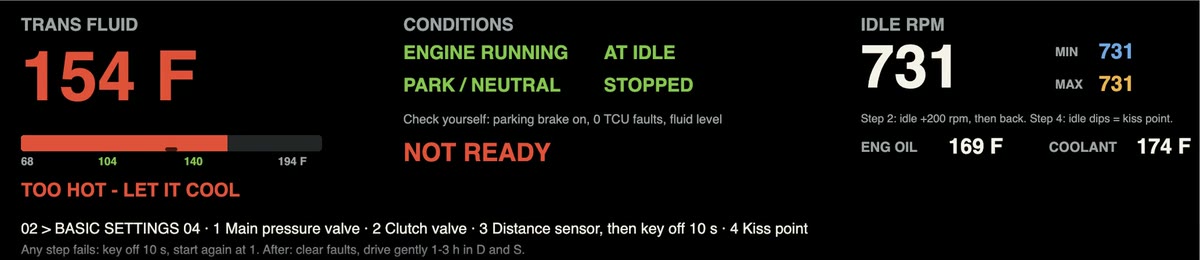
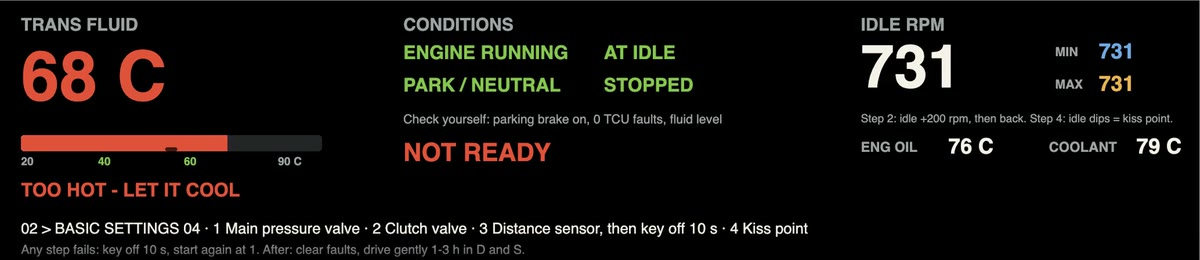
These three pictures are the editor's preview, fed three moments from real logged rows. They show what the screen draws. They are not photos of the unit.
How it is built
- One number, three colors. The big temperature is three
textDataelements in the same place. Each has a test on[Gbx_tOilConv]that returns the number only inside its own range, green for 40 to 60 C, amber for 35 to 40 or 60 to 65, red for everything else, and a blank otherwise. - One bar, three colors. The bar is three stacked
meterelements. The second one only fills when the oil is above 60 C, so it paints the hot end over the first. - A banner that says what is missing. The READY, ALMOST and NOT READY text is a formula over the four conditions (engine running, at idle, gear in P or N, stopped). ALMOST names the one thing still short.
- Min and max. The idle readout keeps the lowest and highest values seen, which is how you catch the idle dip at the kiss point.
- Units switch. The temperature readouts carry a Fahrenheit branch, so the same screen can show either unit.
- A missing reading is honest. The oil temperature sometimes reads 0 on sparse log rows. Under 5 C the screen prints "--" and says NO READING, never a false red.
The screen is generated by a short script, not clicked together, because the three-copies pattern is tedious by hand. A checker evaluates every readout against real log rows the same way the renderer would, so the colors were checked against logged rows, not in a car.
Example two: a full dial screen
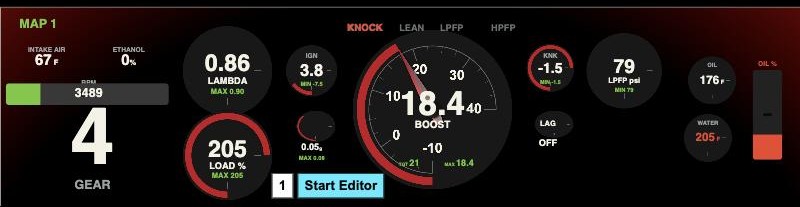
- Dials are
radialNeedleelements with differentstartAngleandticksAngle. A half-circle gauge is the same element with a 180 degree sweep. - Units are done in the monitor formula. The default formulas give Celsius and psi; Fahrenheit is
*9/5+32. A formula can also follow the unit's own setting: the bTres setsswitchF(true for °F) andcalcBoost(true for psi), and OK to Send It reads both, so one screen shows °F and psi or °C and bar. - Trailing zeros are trimmed with a string expression, because the number readouts do not do it for you.
Dial colors
The editor has no color setting for the arc on a dial, and Screen Editor 1.0.5 draws it red. That is not a hard limit: the bTres applies CSS to custom screens, so a text element holding a rule such as #screen_1 canvas{filter:hue-rotate(...)} recolors every arc. OK to Send It does this to turn its red rings green, and an all-teal screen built in the editor and shared in the bTres Facebook group in November 2026 shows the same look can be pushed much further. Other hues are the same rule with a different angle (only red to green is tested here). As written (#screen_1) the rule only works when the screen is custom screen 1; in another slot use #screen_N. Load Logic's original screen already used a canvas hue-rotate; OK to Send It builds on that. Several details of this clone are guesses, such as which variable is the target boost, and none was checked on a car.
Traps that cost time
textData element needs preText and postText, even empty.([a]>80).[name] on screen. The variable is not in the log. Check the spelling against the variable list. Many names exist for some cars and not for others.meter's color zones.image elements travel in the export ZIP. A picture placed inside a text element's HTML is not bundled.Getting it on the car
- Export the screen, which gives a ZIP with
screen_N.json. - Join the bTres unit's own Wi-Fi network from the computer.
- Open the unit's web page, choose Custom Screens, and upload the screen file.
- Restart the bTres so it loads the new screen.
What is proven, and what is not
- Everything on this page that is a picture was drawn by the editor's renderer, and the screens load with no errors.
- The element types, their keys and the expression rules come straight from the editor's code.
- Each color state of the adaptation helper was checked against real logged rows.
- The adaptation helper has been installed on one car but not yet used for an adaptation, and the dial screen has not been checked on a car. The unit's firmware is believed to use the same drawing code as the editor, so the previews should match. If you have a bTres and a DL501, a beta tester is welcome.
- Adding a new element type or key only shows on the car if the unit's firmware understands it. Editor-side features always work.
- Whether a custom DS1 monitor list adds new variables to the bTres is unconfirmed.
- Some variable names in the notes are marked as inferred, not confirmed against a legend.